How to Use Google Analytics 4: A Startup Founder’s Guide to Data-Driven Growth
In the high-stakes world of startups, every decision counts. The difference between scaling to unicorn status and fading into obscurity often boils down to one critical factor: your ability to understand and act on data. Learning how to use Google Analytics 4 (GA4) isn’t just about adopting another analytics platform; it’s about leveraging the most powerful, future-proof data engine available to help you navigate the complexities of user behavior in 2026 and beyond. This isn’t about simply tracking page views; it’s about dissecting the entire customer journey, from first touch to conversion, across every platform.
As a founder, your mission is clear: master how to use Google Analytics 4 to transform raw data into a competitive advantage. This comprehensive guide will equip you with the strategic insights and practical steps to do just that, positioning your startup for explosive, data-backed growth by effectively utilizing GA4’s advanced capabilities.

Why Should Your Startup Use Google Analytics 4 in 2026?
Forget everything you knew about Universal Analytics (UA). GA4 isn’t an upgrade; it’s a complete paradigm shift built for the modern, multi-platform, privacy-first digital landscape. For ambitious startup founders, understanding why this matters is the first step toward harnessing its power.
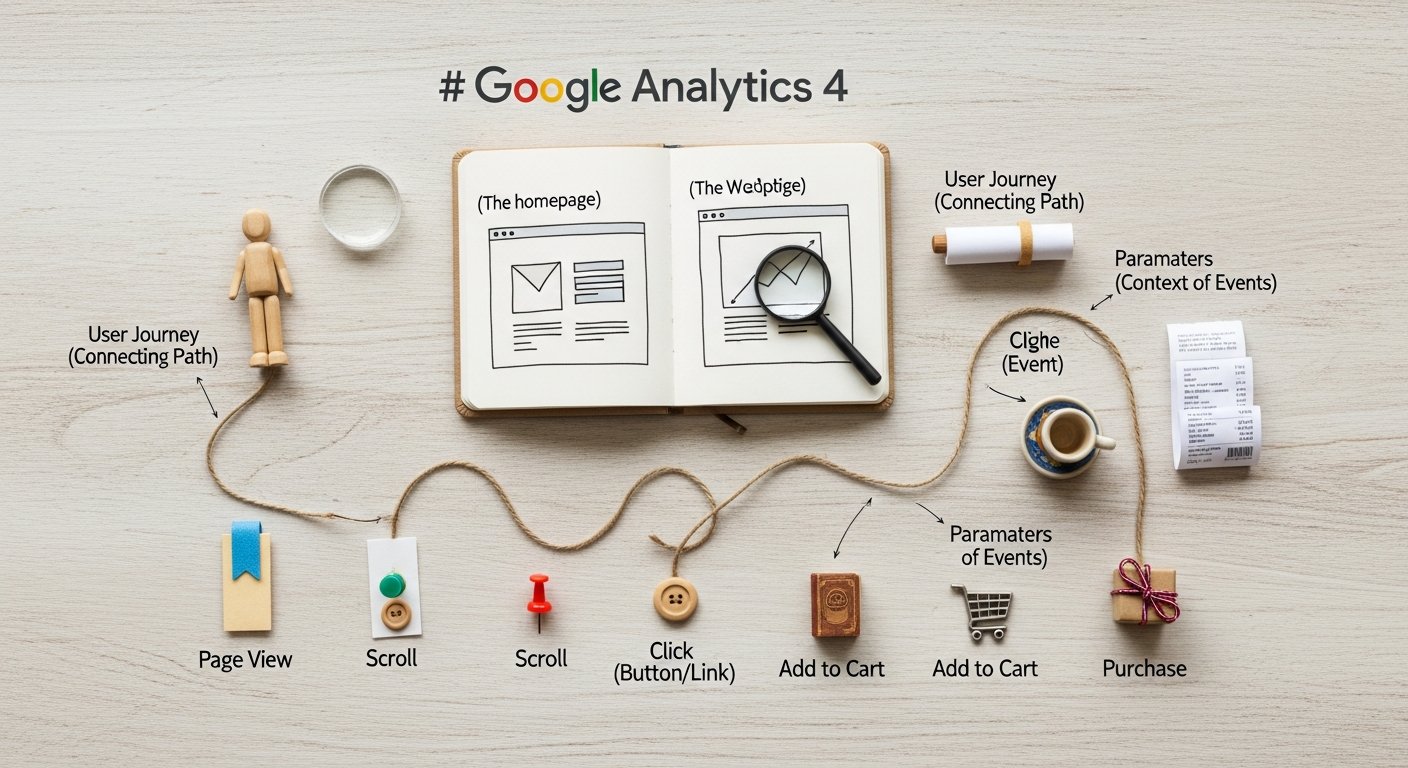
First, GA4 is designed around an event-driven data model. Unlike UA’s session- and pageview-centric approach, GA4 treats every user interaction—a page view, a button click, a video play, a purchase—as an “event.” This unified model provides a far more granular and flexible view of user behavior. Imagine your SaaS platform, “CodeFlow.” With GA4, you can track an engineer’s entire journey: signing up for a free trial (custom event), creating a project (event), inviting team members (event), deploying code (event), and finally subscribing (event). This isn’t just a series of isolated actions; it’s a connected narrative of engagement, allowing you to pinpoint friction points and moments of delight.
Second, GA4 offers cross-platform tracking by design. In 2026, your users aren’t confined to a single device or browser. They might discover your product on a desktop ad, browse on their tablet, and convert on your mobile app. GA4 unifies this fragmented journey, stitching together data from your website and native apps (iOS and Android) into a single property. This gives you a holistic understanding of user behavior, eliminating data silos that often plague traditional analytics setups. For an e-commerce startup like “StyleSync,” this means seeing how a user interacts with a product on their iPhone app, adds it to a cart on their desktop, and completes the purchase later on their tablet – all attributed to the same user. This level of insight is invaluable for optimizing your omnichannel marketing spend and user experience.
Third, GA4 is built with machine learning and predictive capabilities at its core. It can identify patterns in your data to predict user behavior, such as churn probability, purchase probability, and predicted revenue. For a subscription-based startup, knowing which users are likely to churn before they do allows for proactive engagement strategies, saving valuable customer lifetime value. Imagine receiving a notification that a segment of users, who haven’t logged in for a week and haven’t used a key feature, have a high churn probability. This insight empowers you to trigger an automated email campaign offering a new feature tutorial or a personalized discount, directly impacting retention.
Finally, GA4 is engineered for a privacy-centric future. With increasing regulatory scrutiny and the deprecation of third-party cookies, GA4 uses data modeling and Google’s advanced AI to fill in the gaps where traditional tracking might be limited. This means you can still gain valuable insights even with smaller data sets or when consent policies restrict granular tracking, helping your startup remain compliant and data-driven in an evolving digital ecosystem.
In short, GA4 empowers you to move beyond vanity metrics and truly understand user intent, behavior, and value. It’s not just a tool for marketers; it’s a strategic asset for product managers, customer success teams, and ultimately, for you, the founder, to make informed decisions that drive sustainable growth.
What is the GA4 Event-Driven Data Model and How Does it Benefit Founders?
To truly leverage GA4, you must internalize its event-driven model. This is the fundamental difference from its predecessor and the source of its power.
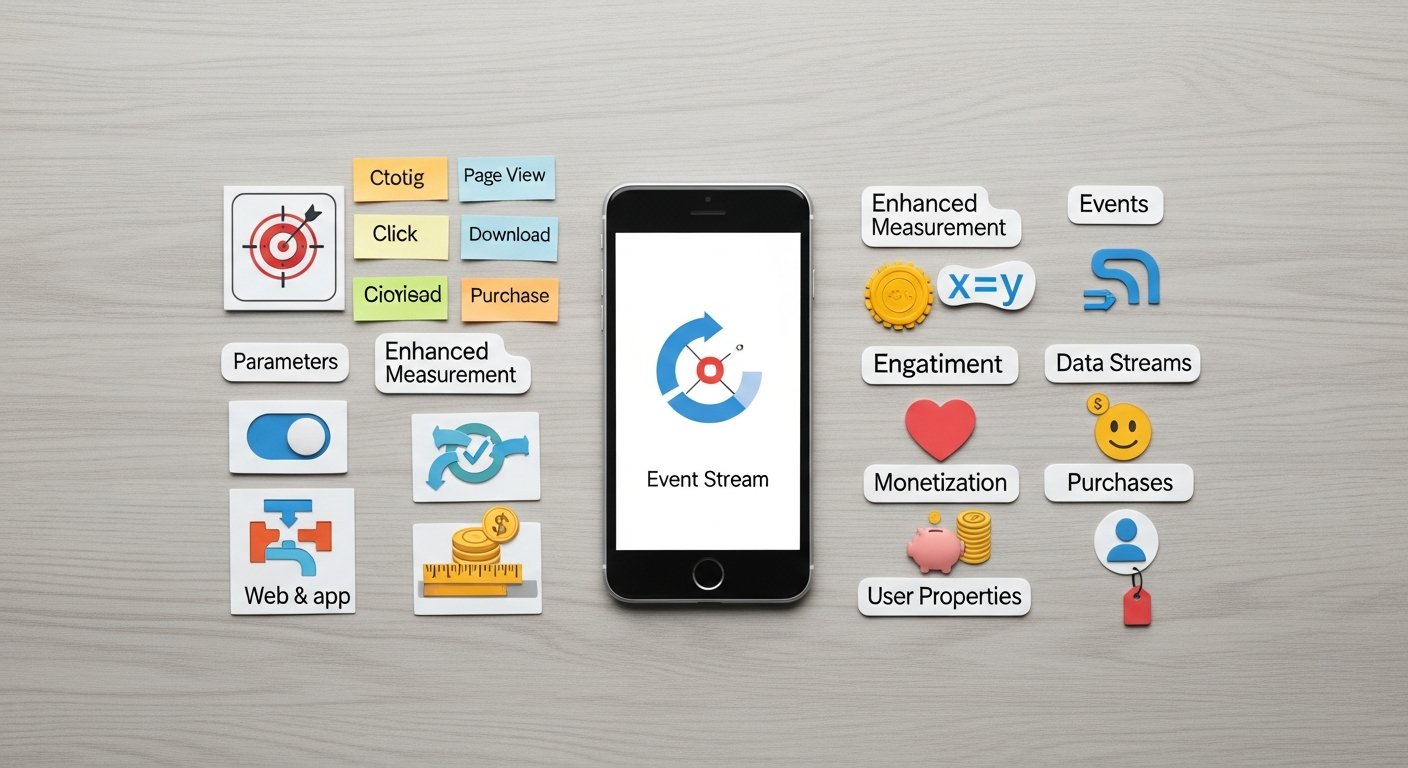
Every single interaction in GA4 is an event. These events fall into four categories:
1. Automatically Collected Events: These are captured by default once you install GA4, such as `first_visit`, `session_start`, `page_view`, `scroll`, `click` (outbound clicks), `view_search_results`, and `video_start`/`progress`/`complete`. These give you a baseline understanding without any extra setup.
2. Enhanced Measurement Events: These are also collected automatically but can be toggled on or off within the GA4 interface. They include `scroll`, `outbound_click`, `site_search`, `video_engagement`, `file_download`, and `form_interactions`. These significantly enrich your data without requiring GTM.
3. Recommended Events: Google suggests these events for specific industries (e.g., `generate_lead` for lead generation, `add_to_cart` for e-commerce, `level_up` for gaming). Following these recommendations ensures you’re collecting data in a standardized way that GA4’s machine learning models can easily interpret for predictive insights.
4. Custom Events: This is where the real power lies for startups with unique business models. You define these events yourself to track specific interactions relevant to your product or service.
Beyond the event name, parameters provide crucial context. For example, a `purchase` event might have parameters like `transaction_id`, `value`, `currency`, `items` (which itself is an array of item parameters like `item_id`, `item_name`, `price`, `quantity`). A `generate_lead` event might have a `lead_source` parameter. These parameters are key to segmenting and analyzing your data with precision.
User properties are attributes that describe a user, rather than a specific event. Examples include `user_id`, `user_cohort`, `subscription_tier`, or `preferred_language`. These persist across sessions and events, allowing you to segment your users based on their unchanging characteristics.
Practical Application for Founders:
* Define Your Key Metrics as Events: Don’t just track; define. What constitutes a “successful” user action for your startup? Is it completing an onboarding flow (`onboarding_complete`)? Reaching a specific feature milestone (`feature_x_used`)? Booking a demo (`demo_booked`)? Map these out.
* Use Google Tag Manager (GTM): While GA4 collects many events automatically, GTM is your essential companion for implementing custom events and parameters without touching your website or app code. It allows your marketing and analytics teams to deploy changes rapidly. If you’re not using GTM, you’re building a wall between your data strategy and execution.
* Think Beyond the Click: An event isn’t just a click. It could be a user spending 30 seconds on a specific section of a landing page, viewing 75% of a product video, or submitting a form field. GA4’s flexibility allows you to capture these nuanced behaviors.
Example: A FinTech Startup, “WealthFlow”
* Goal: Track user engagement with investment tools and identify potential high-value users.
* Custom Events:
* `portfolio_created`: Parameters: `portfolio_type` (e.g., “aggressive,” “conservative”), `initial_investment_amount`.
* `investment_made`: Parameters: `asset_class`, `investment_amount`.
* `goal_set`: Parameters: `goal_type` (e.g., “retirement,” “home purchase”), `target_amount`.
* `advisor_consultation_booked`: (A key conversion event).
* User Properties: `risk_tolerance`, `account_tier` (e.g., “basic,” “premium”), `age_group`.
By defining these events and parameters, WealthFlow can analyze which portfolio types lead to higher long-term engagement, which asset classes are most popular among different age groups, and which user behaviors correlate with booking an advisor consultation. This granular data is the bedrock of intelligent product development and targeted marketing.
How to Set Up Google Analytics 4 for Success: Essential Configuration & Integrations
A robust GA4 setup is non-negotiable for data-driven decision-making. This isn’t just about slapping a code snippet on your site; it’s about strategic configuration.
How to Implement GA4 with Google Tag Manager (GTM)?
If you’re not using GTM, start now. It’s the most efficient way to manage your GA4 implementation.

* Step 1: Create a GTM Container: If you don’t have one, set it up.
* Step 2: Add GA4 Configuration Tag: In GTM, create a new “Google Analytics: GA4 Configuration” tag. Enter your GA4 Measurement ID (G-XXXXXXXXX). Set it to fire on “All Pages.” This establishes the basic connection.
* Step 3: Implement Custom Events: For every custom event you defined, create a new “Google Analytics: GA4 Event” tag in GTM.
* Specify the Event Name (e.g., `onboarding_complete`).
* Add Event Parameters: For each parameter (e.g., `step_number`), define its name and pull its value from a GTM variable (e.g., a Data Layer Variable or a Custom JavaScript variable).
* Set the Trigger: This is crucial. For `onboarding_complete`, it might be a “Page View” trigger for a specific URL (`/onboarding/complete`) or a “Click” trigger on a “Complete Onboarding” button.
Pro-Tip: Use a consistent naming convention for your events and parameters. This will save you headaches down the line when analyzing data.
How to Link Key Google Products with GA4?
GA4’s power multiplies when integrated with other Google services.
* Google Ads: Link your GA4 property to Google Ads to import GA4 conversions (e.g., `purchase`, `generate_lead`) directly into Ads for more optimized campaign bidding. You can also leverage GA4 audiences (e.g., “users who added to cart but didn’t purchase”) for retargeting. This is fundamental for maximizing your ad spend ROI.
* Google Search Console: While not a direct GA4 integration in the same way as Ads, ensure your Search Console is verified and linked to your website. While GA4 doesn’t import Search Console data directly, Search Console provides invaluable insights into organic search performance that complement your GA4 behavioral data. You’ll often analyze them side-by-side.
* BigQuery: For scaling startups, BigQuery integration is a game-changer. GA4 allows for a free, direct export of all your raw, unsampled event data into BigQuery. This unlocks advanced analysis, custom reporting, data warehousing, and the ability to join GA4 data with other internal datasets (CRM, sales data). We’ll touch on this more later.
How to Configure Custom Definitions in GA4?
GA4 automatically collects many standard parameters (e.g., `page_location`, `page_title`). However, your custom event parameters and user properties need to be “registered” in GA4 as custom definitions (custom dimensions or custom metrics) to be visible in standard reports and Explorations.
* Navigate: Admin > Data display > Custom definitions.
* Create Custom Dimensions: For parameters that describe attributes (e.g., `portfolio_type`, `lead_source`), create a custom dimension.
* Create Custom Metrics: For parameters that represent quantifiable values (e.g., `initial_investment_amount`, `discount_amount`), create a custom metric.
Without this step, your carefully collected custom data will be largely inaccessible for analysis within the GA4 UI.
How to Set Up Conversions in Google Analytics 4?
Identify your most critical events and mark them as conversions.
* Navigate: Admin > Data display > Conversions.
* New Conversion Event: Enter the exact event name (e.g., `generate_lead`, `purchase`, `subscription_started`).
* Why: Marking an event as a conversion allows you to easily track your most important business outcomes, optimize Google Ads campaigns, and quickly see your performance against key KPIs in reports.
How to Adjust Data Retention Settings in GA4?
By default, GA4 retains event-level data for 2 months. For deeper historical analysis, particularly in Explorations, you’ll want to extend this.
* Navigate: Admin > Data collection and modification > Data Retention.
* Set to 14 months: This is the maximum for free GA4 properties. For BigQuery exports, data is retained indefinitely.
A meticulous setup ensures your data is clean, comprehensive, and ready for advanced analysis. Don’t rush this stage; it’s the foundation of your entire data strategy.
How to Master Google Analytics 4 Reports for Actionable Insights?
GA4 offers a powerful suite of reporting tools. As a founder, your focus should be on extracting actionable insights, not just passively viewing numbers.
What are Standard Reports in GA4 and How to Use Them?
The “Reports” section in GA4 provides pre-built reports designed to answer common business questions.
* Realtime Report: See what’s happening on your site/app right now. Useful for validating new tag deployments or monitoring the immediate impact of a campaign launch.
* Acquisition Reports: Understand where your users are coming from.
* User acquisition: How are new users arriving? (e.g., “Organic Search,” “Paid Search,” “Referral”).
* Traffic acquisition: How are all sessions being acquired?
* Actionable Insight: If your “Paid Search” channel shows a high number of new users but low engagement (bounce rate, average engagement time), it suggests a disconnect between your ad creative/targeting and your landing page experience.
* Engagement Reports: Measure how users interact with your content.
* Events: See which events are firing most frequently. Sort by event count to identify popular interactions.
* Conversions: Track your key business outcomes.
* Pages and screens: See your most viewed content.
* Actionable Insight: If your `add_to_cart` event count is high but `purchase` conversion is low, investigate your checkout flow. Is there a technical glitch? Are shipping costs too high?
* Monetization Reports (for e-commerce/apps): Track revenue, purchases, and product performance.
* Actionable Insight: Identify your top-performing products, analyze average order value, and understand customer lifetime value trends.
* Retention Reports: Analyze how well you retain users over time.
* Actionable Insight: If your `New users` vs. `Returning users` retention cohort drops significantly after week 1, investigate the first-week experience. Are users finding value quickly? Is your onboarding effective?
Leverage Comparisons: Use the “Add comparison” feature in standard reports to segment your data. Compare “Mobile users” vs. “Desktop users,” or “Users from Campaign A” vs. “Users from Campaign B.” This immediately highlights performance differences.
How to Use GA4 Explorations for Deep-Dive Analysis?
This is where GA4 truly shines for deep-dive analysis. Explorations allow you to build custom reports, visualize data, and uncover complex patterns. Access it via the “Explore” section in the left navigation.

* Free-Form Exploration: A versatile canvas for drag-and-drop analysis.
* Use Case: Analyze the relationship between `user_cohort` (custom dimension) and `average_engagement_time`.
* Step-by-step:
1. Start a new “Free-form” exploration.
2. Under “Dimensions,” add `User cohort` (if you’ve defined it) and `Device category`.
3. Under “Metrics,” add `Average engagement time` and `Conversions`.
4. Drag `User cohort` to “Rows,” `Device category` to “Columns.”
5. Drag `Average engagement time` and `Conversions` to “Values.”
6. Result: A pivot table showing engagement and conversions by user cohort and device, immediately highlighting which cohorts are more engaged on which devices.
* Funnel Exploration: Visualize the steps users take to complete a conversion. Essential for optimizing critical user flows.
* Use Case: Optimize your signup process for a new user on your “InsightHub” content platform.
* Step-by-step:
1. Start a new “Funnel exploration.”
2. Define each “Step” as an event:
* Step 1: `page_view` (where `page_location` contains `/signup/step1`)
* Step 2: `page_view` (where `page_location` contains `/signup/step2`)
* Step 3: `signup_complete` (custom event)
3. Result: A visual representation of drop-off rates at each stage.
4. Actionable Insight: If 80% drop off between Step 1 and Step 2, investigate that specific page/form. Is it too long? Are there technical errors?
* Path Exploration: Discover the actual user journeys. What do users do before or after a specific event?
* Use Case: Understand what users do immediately after completing a purchase on “StyleSync.”
* Step-by-step:
1. Start a new “Path exploration.”
2. Select “Event name” for the steps.
3. Choose `purchase` as the starting or ending point.
4. Result: A tree graph showing the sequence of events.
5. Actionable Insight: If many users go from `purchase` to `view_product_page` (for related products) but few then `add_to_cart`, your post-purchase upsell strategy might need refinement.
* Segment Overlap: Understand how different user segments interact.
* Use Case: See how many “High-value purchasers” (segment A) are also “Mobile app users” (segment B).
* Actionable Insight: If there’s significant overlap, you might prioritize mobile app features for your high-value customers. If there’s little, you might need separate strategies.
Segments: In Explorations, you can build powerful segments of users (e.g., “Users who made a purchase,” “Users from specific geographic regions,” “Users who viewed a specific product category”). These segments can then be applied to any report or exploration and even exported to Google Ads for retargeting.
How Can Google Analytics 4 Data Drive Your Startup’s Growth Strategies?
Data is meaningless without action. Here’s how to translate GA4 insights into tangible growth for your startup.
How to Optimize User Acquisition Spend Using GA4 Data?
* Insight: Your “Paid Search” users have a significantly lower `user_engagement` time and `conversion_rate` compared to “Organic Search” users.
* Action:
* Review Ad Copy & Keywords: Are your ads attracting the right audience? Are your keywords too broad?
* Improve Landing Page Experience: Is the landing page relevant to the ad? Does it load quickly? Is the call to action clear? Use GA4’s `scroll` and `form_start`/`form_submit` events to pinpoint issues.
* Segment Paid Traffic: Use an Exploration to compare paid traffic from different campaigns or ad groups. Identify the best performers and reallocate budget.
How to Enhance Product Experience & Features with GA4 Insights?
* Insight: A high drop-off rate in your `onboarding_flow` funnel exploration.
* Action:
* User Research: Conduct qualitative interviews with users who dropped off at that specific step.
* A/B Test: Use a tool like Google Optimize (or a similar A/B testing platform) to test different onboarding designs, clearer instructions, or fewer steps. Track the `onboarding_complete` event as your primary metric.
* Prioritize Feature Development: If `feature_X_used` event is highly correlated with `subscription_renewed` (based on a Free-Form Exploration), prioritize further development and promotion of Feature X.
How to Boost Customer Retention with Google Analytics 4?
* Insight: Your `churn_probability` predictive metric indicates a specific segment of users is at high risk. These users also show a decrease in `key_feature_X_used` event counts.
* Action:
* Proactive Outreach: Trigger automated email or in-app messages to this segment, offering personalized tips for using Feature X, showcasing new relevant features, or providing a direct line to support.
* Targeted Content: Create tutorials or blog posts specifically addressing common pain points or unexplored features relevant to this segment.
* Re-engagement Campaigns: Use GA4 audiences (e.g., “Users with high churn probability who haven’t used Feature X in 7 days”) in Google Ads for targeted re-engagement campaigns.
How to Personalize Marketing & Content Using GA4?
* Insight: Your “Path Exploration” shows users who view “Product Category A” often also view “Blog Post X.”
* Action:
* Content Strategy: Create more content similar to “Blog Post X” that targets users interested in “Product Category A.”
* Personalized Recommendations: Implement dynamic content on your site that recommends “Blog Post X” to users viewing “Product Category A,” or vice-versa.
* Email Segmentation: If a user views “Product Category A” but doesn’t convert, add them to an audience in GA4 and send a follow-up email showcasing that category’s benefits or related content.
The core principle is to identify a problem or opportunity from the data, formulate a hypothesis, implement a solution, and then use GA4 to measure the impact. This iterative, data-driven cycle is how startups scale effectively.
What are Advanced Google Analytics 4 Tactics for Scaling Startups?
As your startup grows, your GA4 strategy needs to evolve. These advanced tactics will help you extract even deeper value.
How to Leverage Predictive Metrics in GA4?
GA4’s machine learning capabilities are not just theoretical; they’re actionable. Look for these in your “Reports > Monetization > Purchase probability” and “Reports > Retention > Churn probability” reports.
* Purchase Probability: Identifies users most likely to make a purchase in the next 7 days.
* Churn Probability: Identifies users most likely to churn in the next 7 days.
* Predicted Revenue: Estimates the revenue from all purchase conversions in the next 28 days from users who were active in the last 28 days.
Action for Founders:
* Create Predictive Audiences: In “Admin > Audiences,” create audiences based on these predictive metrics (e.g., “Users likely to purchase,” “Users likely to churn”).
* Targeted Campaigns: Export these audiences to Google Ads for highly targeted campaigns. Offer a special incentive to users with high purchase probability, or a retention offer to those with high churn probability.
* Product Prioritization: Analyze the behavior of users identified as “high purchase probability” to understand what drives their intent. Use these insights to refine product features or marketing messages.
How to Integrate GA4 with BigQuery for Advanced Data Access?
For serious data analysis, BigQuery integration is a must.
* Why: GA4’s UI has limitations (e.g., sampling, limited custom dimensions/metrics for direct reporting). BigQuery gives you access to every single raw event and parameter, unsampled, indefinitely, and allows you to join GA4 data with other datasets.
* Setup: In GA4 Admin, navigate to “Product Links” and link to BigQuery. Choose your project.
* Use Cases:
* Custom Attribution Models: Build your own multi-touch attribution models beyond GA4’s default last-click or data-driven models.
* Deep Cohort Analysis: Analyze user cohorts based on highly specific criteria (e.g., users who completed `event_A` and `event_B` within 24 hours).
* LTV Modeling: Combine GA4 behavioral data with CRM data (e.g., subscription value) to build more accurate Lifetime Value models.
* Machine Learning: Export data for advanced ML models (e.g., customer segmentation, anomaly detection).
* Custom Dashboards: Build highly customized dashboards in tools like Looker Studio (formerly Google Data Studio) or Tableau, leveraging the full power of BigQuery SQL queries.
Example: A SaaS Startup with BigQuery
“CodeFlow” wants to understand the LTV of users based on their onboarding path. They can export GA4 data to BigQuery, join it with their subscription database (which contains actual revenue per user), and then query:
`SELECT user_id, onboarding_path, SUM(revenue) as total_LTV FROM ga4_data JOIN crm_data ON ga4_data.user_id = crm_data.user_id GROUP BY onboarding_path ORDER BY total_LTV DESC`
This query would immediately show which onboarding paths lead to the highest LTV, informing product and marketing decisions.
How to Use Custom Dimensions & Metrics Beyond GA4 UI Limits?
While GA4 has limits on the number of custom dimensions and metrics you can register in the UI, BigQuery removes these constraints. You can create as many as you need within BigQuery by extracting parameters from your raw event data.
* Action: If you have many nuanced parameters that you can’t register as custom definitions in the GA4 UI, you can still access and analyze them in BigQuery by querying the `event_params` array. This ensures no valuable data is left behind.
What is Server-Side Tagging with GTM and How to Implement it for GA4?
For enhanced data accuracy, security, and performance, consider implementing GTM’s server-side tagging.
* Why: Instead of sending data directly from the user’s browser to GA4, data is first sent to your own tagging server (hosted on Google Cloud Platform). This server then forwards the data to GA4 and other vendors.
* Benefits:
* Improved Data Quality: More resilient to ad blockers and browser privacy features.
* Enhanced Security: Sensitive data can be cleaned or transformed on the server before being sent to third parties.
* Performance: Offloads processing from the user’s browser, potentially speeding up page loads.
* Action: This is a more technical implementation but offers significant advantages for data integrity. Plan to explore this as your data infrastructure matures.
These advanced tactics move beyond basic reporting and into the realm of true data engineering and strategic analysis, enabling your startup to build a robust, future-proof data ecosystem.
FAQ: Google Analytics 4 for Startup Founders
Is GA4 really necessary for my startup, or can I stick with older analytics tools?
A1: Absolutely necessary. Sticking with older tools means you’re operating with outdated data models, missing crucial cross-platform insights, and falling behind on privacy compliance. GA4 is built for the current and future digital landscape (post-cookie, app+web focus). Relying on anything else is like building a skyscraper with a shovel – inefficient and ultimately unstable.
How much does GA4 cost? Is it suitable for bootstrapped startups?
A2: GA4 is free for most startups. The core platform, including unlimited data collection (up to 10 billion events per month for standard properties) and integration with BigQuery for raw data export, comes at no cost. You only incur costs if your BigQuery usage exceeds its generous free tier, which is rare for early-stage startups. So yes, it’s highly suitable and cost-effective for bootstrapped ventures.
What’s the single most important thing I should focus on when starting with GA4?
A3: Focus on defining and tracking your key conversion events with relevant parameters. Identify the 3-5 actions that directly drive your business outcomes (e.g., `subscription_started`, `lead_generated`, `product_purchased`, `app_download`). Get these right first. Once you know what success looks like, you can then analyze the paths and sources that lead to it.
My data in GA4 looks different from my previous analytics platform. Why?
A4: This is expected and normal. GA4 uses a fundamentally different data model (event-driven vs. session-based) and different metrics definitions. For example, “users” might be calculated differently, and “bounce rate” has been replaced by “engagement rate.” Don’t try to directly compare old and new numbers. Instead, establish new benchmarks within GA4 and focus on trend analysis and comparative performance within GA4’s framework.
How can I use GA4 to understand my app users specifically?
A5: GA4 excels here due to its app+web model. Ensure your mobile app (iOS/Android) is integrated via the Firebase SDK. Once integrated, GA4 automatically collects many app-specific events (e.g., `app_remove`, `app_update`, `first_open`). You can then create custom events for unique app interactions (e.g., `in_app_purchase`, `feature_X_used_in_app`). Use the “Device category” dimension in your reports and Explorations to filter specifically for “mobile” or “tablet” app usage, and leverage Path Explorations to map app user journeys.
Conclusion: Your Data-Driven Future Starts Now
The digital landscape of 2026 demands a sophisticated, adaptable approach to analytics. Google Analytics 4 isn’t just a tool; it’s a strategic imperative for any startup founder aiming for sustainable growth. By embracing its event-driven model, meticulously configuring your setup, and mastering its powerful reporting and exploration capabilities, you transform raw data into a clear roadmap for success.
Remember, the journey doesn’t end with implementation. Your GA4 strategy must be iterative, continually refined by the insights you uncover. Question your assumptions, test your hypotheses, and let the data guide every product decision, marketing campaign, and user experience enhancement. The founders who truly understand their users—their motivations, behaviors, and pain points—are the ones who will build enduring, market-leading companies. Arm yourself with GA4, and embark on your data-driven future with confidence.