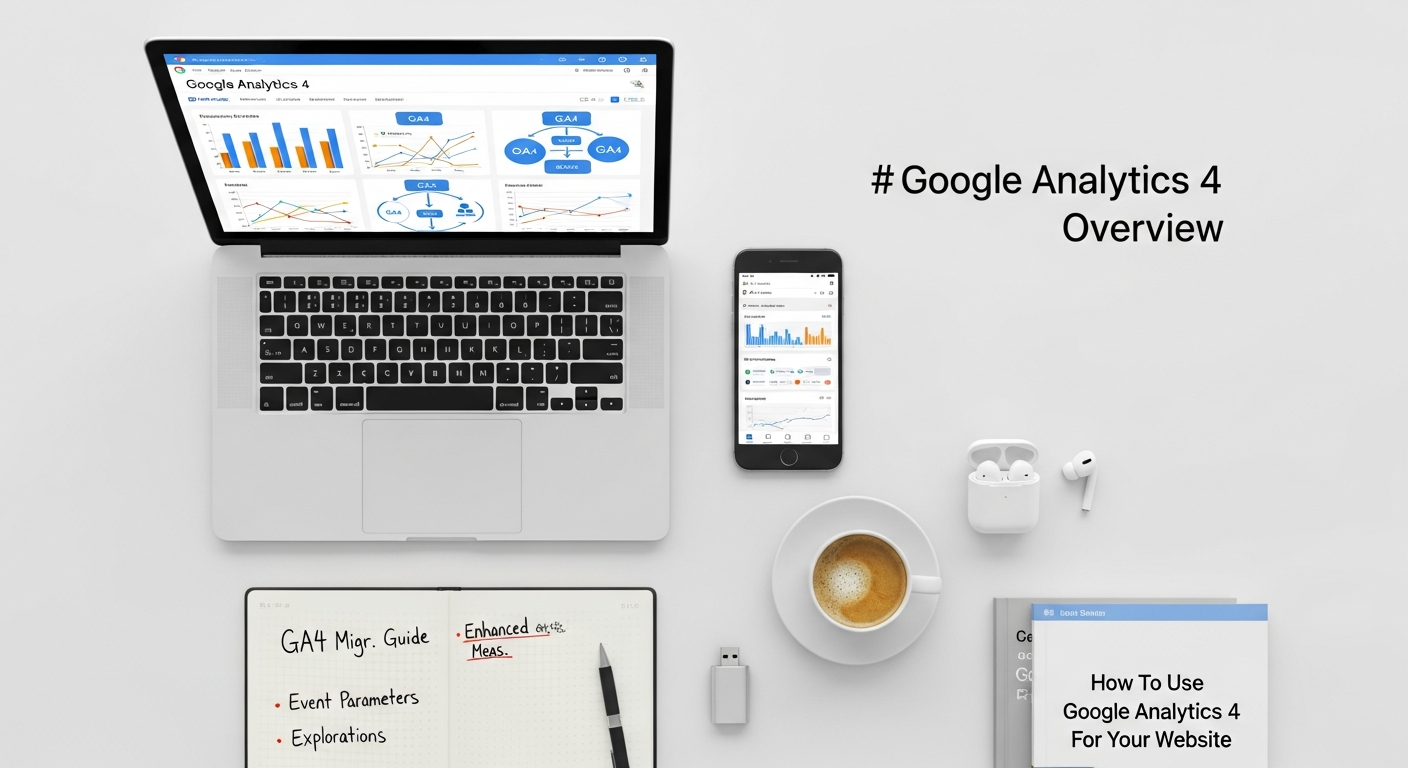
The Evolution to Google Analytics 4: Why It Matters Now
The digital landscape is in constant flux, shaped by technological advancements, shifting user expectations, and, perhaps most significantly, an increasing emphasis on data privacy. Google Analytics 4 represents a fundamental paradigm shift from its predecessor, Universal Analytics, designed to meet these modern challenges head-on. Understanding this evolution is crucial for grasping GA4’s power and necessity.
Universal Analytics, while revolutionary in its time, was built around a session-based model, primarily tracking page views and sessions. This model made sense in an era dominated by desktop web browsing, but it struggled to provide a unified view of users interacting across multiple devices and platforms (websites and mobile apps). GA4, by contrast, adopts an event-driven data model. In GA4, virtually every user interaction—from a page view to a button click, a video play, or a purchase—is treated as an event. This unified approach allows for a much more granular and flexible understanding of the complete customer journey, irrespective of the platform they are using.
A significant driver behind GA4’s development is the global movement towards enhanced data privacy. Regulations like GDPR and CCPA have reshaped how businesses collect and process user data. GA4 was built with a privacy-first approach, offering more robust controls over data collection, retention, and anonymization. It is also designed to operate effectively in a future with fewer cookies, leveraging machine learning and modeling to fill data gaps where user consent for traditional tracking methods might be absent. This forward-thinking design ensures that your analytics strategy remains resilient and compliant in an increasingly privacy-conscious world. For tech startups, especially those operating across different regions, navigating these privacy requirements is a significant challenge, and GA4 provides a more robust framework for compliance.
Furthermore, GA4 integrates powerful machine learning capabilities that go beyond simple data reporting. It can identify trends, predict user behavior (such as churn probability or purchase intent), and automatically surface insights that might otherwise be missed. This predictive power is invaluable for startups looking to optimize their marketing spend, personalize user experiences, and make proactive business decisions. For instance, understanding which users are likely to churn allows for targeted retention campaigns, a critical aspect of sustainable growth for any new venture.
The urgency to transition to GA4 cannot be overstated. With Universal Analytics properties ceasing to process new hits from July 1, 2026, businesses that haven’t migrated will lose access to new historical data and the ability to track ongoing performance using their old setups. This makes understanding and implementing GA4 not just a best practice but a foundational requirement for maintaining continuous data-driven insights for your website. Ignoring this transition could leave your startup without critical performance metrics, akin to trying to build a robust tech stack without a clear understanding of its components and their interoperability.
Getting Started with Google Analytics 4: Setup and Initial Configuration
Embarking on your GA4 journey begins with setting up your property and configuring its initial settings. This foundational step ensures accurate data collection and lays the groundwork for meaningful analysis.
The first step is to create a new GA4 property. If you have an existing Universal Analytics property, Google often provides a “GA4 Setup Assistant” directly within your UA interface to streamline the process, allowing you to create a new GA4 property that leverages some of your existing settings without affecting your UA data collection. Alternatively, you can create a new GA4 property from scratch by navigating to the “Admin” section in Google Analytics and selecting “Create Property.” During this process, you’ll be prompted to name your property, select your industry category, reporting time zone, and currency. These basic settings are crucial for accurate localized reporting and financial metrics, especially for e-commerce sites or those with international audiences.
Once your property is created, the next critical step is to set up Data Streams. GA4 is designed to unify data from various sources, and data streams are the pipelines through which this data flows. You’ll typically set up at least one “Web” data stream for your website. If your startup also has a mobile app (iOS or Android), you’ll create separate data streams for those as well. When configuring your web data stream, you’ll provide your website’s URL and a stream name. Crucially, you’ll also find the “Measurement ID” (starting with ‘G-‘), which is unique to your GA4 property and essential for connecting your website.
The installation of the GA4 tracking code on your website is the next hurdle. There are several common methods:
- Google Tag Manager (GTM): This is the recommended approach for most businesses, especially startups that value flexibility and control over their tracking implementation without needing developer intervention for every change. Within GTM, you’ll create a new GA4 Configuration Tag, input your Measurement ID, and set it to fire on all pages. GTM acts as an intermediary, allowing you to manage all your website tags (including GA4, Google Ads conversion tags, Facebook Pixel, etc.) from a single interface. This is particularly useful for managing various marketing tags related to initiatives like Pay Per Click advertising, ensuring consistent and accurate tracking across all campaigns.
-
Global Site Tag (gtag.js): If you’re not using GTM, you can directly embed the gtag.js code snippet into the
<head>section of every page on your website. Google provides this snippet directly within your GA4 web data stream settings. While simpler for very basic setups, it requires direct code modification for any future tracking adjustments. - CMS Plugins: For websites built on platforms like WordPress, Shopify, or Wix, there are often dedicated plugins or built-in integrations that simplify the GA4 setup. These typically ask for your Measurement ID and handle the code placement automatically.
Beyond basic installation, consider connecting your GA4 property with other Google services. Linking to Google Ads is paramount for any business running paid campaigns. This integration allows you to import GA4 conversions into Google Ads for better bid optimization, and conversely, to see Google Ads campaign performance directly within GA4 reports. This synergy is vital for maximizing the ROI of your PPC efforts. Similarly, connecting with Google Search Console provides valuable insights into organic search performance, while linking to BigQuery (an advanced data warehousing service) unlocks possibilities for custom, high-volume data analysis, especially for rapidly scaling tech startups with complex data needs.
Finally, enable Enhanced Measurement within your web data stream settings. This feature automatically tracks a suite of common events like scrolls, outbound clicks, site search, video engagement, and file downloads without requiring additional code. This provides immediate, valuable insights into user engagement beyond just page views, giving your startup a head start in understanding key interactions on your site.
Understanding the GA4 Data Model: Events, Parameters, and User Properties
Everything is an Event
In GA4, everything is an event. Unlike Universal Analytics, where there were distinct “hit types” (pageviews, events, transactions, social interactions, etc.), GA4 consolidates all user interactions into a single, unified event structure. A page view is an page_view event, a button click is a click event, a form submission can be a generate_lead event, and a purchase is a purchase event. This consistency simplifies data collection and allows for a much more nuanced understanding of the user journey across your website and apps.
GA4 categorizes events into four main types:
-
Automatically collected events: These are events GA4 collects by default as soon as you install the tracking code. Examples include
session_start,first_visit, anduser_engagement. These provide foundational data about user activity. -
Enhanced measurement events: As mentioned earlier, these are automatically collected if enabled in your data stream settings. They include valuable interactions like
scroll,click(for outbound links),view_search_results,video_start,video_progress,video_complete, andfile_download. For a startup, these events offer immediate insights into content engagement and user intent without any additional setup. -
Recommended events: Google provides a list of suggested events for various industries (e.g., e-commerce, gaming) that have predefined names and parameters. Examples include
login,add_to_cart,begin_checkout, andpurchase. Using recommended events ensures consistency and allows GA4’s machine learning capabilities to better understand your data and provide predictive insights. -
Custom events: When automatically collected or recommended events don’t fit your specific tracking needs, you can create custom events. These are crucial for tracking unique interactions specific to your business model or product features. For a SaaS startup, this might include tracking
feature_used,plan_upgraded, orproject_created(which could then be analyzed to understand feature adoption and correlate with customer success, potentially even informing the selection of the best project management software for startups if those actions are related to project-based features). Custom events provide the ultimate flexibility but require careful planning and consistent naming conventions.
Parameters: Enriching Event Data
Events alone tell you that something happened, but parameters tell you the details of what happened. Every event can have multiple parameters associated with it, providing context and additional information. For example:
-
A
page_viewevent might have parameters likepage_location(the URL),page_title, andreferrer. -
A
purchaseevent would typically include parameters such astransaction_id,value,currency, and an array ofitems(each with its own parameters likeitem_id,item_name,price,quantity). -
A custom
feature_usedevent could have parameters likefeature_name,plan_type, anduser_id.
Parameters are incredibly powerful because they allow you to segment and analyze your data with much greater specificity. You can ask questions like: “What was the average purchase value for users who clicked on a specific banner ad?” or “Which specific features are most used by users on our premium plan?”
User Properties: Understanding Your Audience
While events and parameters describe what users do, user properties describe who your users are. These are attributes that persist across a user’s entire journey, providing demographic or behavioral context. Examples of automatically collected user properties include age, gender, and language (derived from browser settings or Google signals).
You can also define custom user properties to capture information relevant to your business. For a SaaS startup, this might include subscription_status (free, premium), company_size, or industry. By combining event data with user properties, you can build rich audience segments and gain deeper insights, such as “How do users with a ‘premium’ subscription status interact with our new features compared to ‘free’ users?” This understanding is vital for product development, marketing segmentation, and personalization.
To make custom event parameters and user properties visible in your GA4 reports, you need to register them as custom definitions (custom dimensions or custom metrics) within the GA4 interface under “Admin” > “Custom definitions.” This step is crucial, as unregistered parameters will only be visible in tools like BigQuery or DebugView, not in standard reports.
The event-driven model of GA4, combined with the power of parameters and user properties, offers an unparalleled level of flexibility and detail. It empowers startups to move beyond surface-level metrics and truly understand the nuances of user behavior, enabling more informed decisions about product development, marketing strategies, and overall business growth.
Navigating the GA4 Interface and Core Reports for Actionable Insights

Once your Google Analytics 4 property is set up and collecting data, the next step is to navigate its interface and extract actionable insights from its reports. GA4’s interface is significantly different from Universal Analytics, designed to be more intuitive for understanding the user journey.
Upon logging into your GA4 property, you’ll be greeted by the Home page, which provides a high-level overview of your website’s performance, highlighting key metrics like users, conversions, and revenue. This page often includes “Insights,” powered by GA4’s machine learning, to surface important trends or anomalies automatically.
The left-hand navigation bar is your primary tool for exploring data. It’s organized into logical sections to help you understand different aspects of your user base and their interactions:
- Reports Snapshot: A customizable dashboard offering a quick glance at key performance indicators.
- Realtime: This report is invaluable for seeing what’s happening on your website right now. It shows active users, top events, conversions, and geographic locations in real-time. For startups launching a new campaign, product feature, or running a special promotion, the Realtime report provides immediate feedback on user engagement and the efficacy of your efforts. You can even see events fire as you interact with your site, which is excellent for debugging.
-
Life cycle: This section is where you’ll find the bulk of your standard reports, organized to follow the typical customer journey.
-
Acquisition: These reports focus on how users find your website.
- User acquisition: Shows the first channel a user came from, helping you understand the initial source of your users.
- Traffic acquisition: Reveals the channels driving sessions (or engaged sessions) to your site. These reports are critical for evaluating the performance of your marketing channels, including organic search, social media, email, and especially your paid campaigns from Pay Per Click advertising platforms like Google Ads. You can see which campaigns are bringing in engaged users and conversions, allowing you to optimize your ad spend.
-
Engagement: These reports delve into what users do once they are on your site.
- Events: A comprehensive list of all events fired on your website, along with their counts. This is where you can see the volume of page views, clicks, form submissions, and any custom events you’ve set up. You can click into individual events to see more detail, including associated parameters.
- Conversions: This report lists all the events you’ve marked as conversions (e.g., purchases, lead form submissions, sign-ups). It’s the ultimate measure of success for your website’s goals and directly informs your marketing ROI.
- Pages and screens: Shows which pages on your website are most viewed, along with metrics like engaged sessions and average engagement time. This helps you understand your most popular content and areas where users spend the most time.
- Landing page: Similar to UA, this report identifies the first page a user lands on, providing insights into entry points and their effectiveness.
- Monetization: For e-commerce businesses, this section is vital. It includes reports on e-commerce purchases, in-app purchases, publisher ads, and overall revenue, helping you track product performance and sales funnels.
- Retention: These reports help you understand how well you retain users over time. They include metrics like new vs. returning users, retention by cohort, and user lifetime value, crucial for subscription-based startups or those focused on building a loyal customer base.
-
Acquisition: These reports focus on how users find your website.
-
User: This section provides demographic and tech-related information about your users.
- Demographics: Age, gender, interests (if Google Signals is enabled).
- Tech: Browser, operating system, device category, screen resolution – essential for ensuring your website provides a good user experience across different environments, which is a key consideration when planning your tech stack and front-end development.
Understanding Key GA4 Metrics
GA4 introduces new metrics and redefines some old ones, emphasizing user engagement:
- Users: GA4 focuses on “Active Users” (users who have an engaged session or at least one event) rather than “Total Users” in UA.
- Engaged Sessions: A session that lasts longer than 10 seconds, has a conversion event, or has 2 or more page views/screen views. This is a much better indicator of quality engagement than simply counting sessions.
- Average Engagement Time: The average time your website was in the foreground on a user’s device. This replaces “Average Session Duration” and provides a more accurate measure of active user time.
- Engagement Rate: The percentage of engaged sessions. This metric effectively replaces and improves upon the “Bounce Rate” from UA, giving you a clearer picture of how sticky your content is.
- Conversions: The count of conversion events, which you define based on your business objectives.
Customizing Reports and Comparisons
GA4 offers significant flexibility for customizing your reporting experience. The “Library” in the left navigation allows you to create custom report collections and modify existing ones, tailoring the interface to your specific needs. You can also apply “Comparisons” to any report to segment your data on the fly (e.g., comparing mobile users to desktop users, or users from a specific campaign versus all users). This feature is incredibly powerful for isolating performance differences and testing hypotheses.
By familiarizing yourself with these reports and metrics, your startup can gain crucial insights into user behavior, marketing channel performance, and conversion pathways, enabling data-driven decisions that fuel growth and optimize your digital presence.
Leveraging Advanced GA4 Features for Deep Dive Analysis
While GA4’s standard reports provide a solid overview, its true power for deep dive analysis lies in its advanced features, particularly the “Explorations” section. This suite of tools empowers startups and digital marketers to go beyond predefined reports, ask complex questions, and uncover unique insights tailored to their specific business objectives.
Explorations: Your Custom Analytics Sandbox
The “Explorations” (formerly known as “Analysis Hub”) section is where you can build highly customized reports and visualizations using your raw GA4 event data. It’s a flexible canvas for answering specific questions about user behavior, product adoption, and conversion paths. Here are some of the key exploration types:
-
Free-form Exploration: This is the most versatile tool, allowing you to drag and drop dimensions and metrics to create custom tables and charts. You can segment your data, apply filters, and pivot tables to examine specific data points. For instance, a tech startup might use this to analyze the number of
feature_usedevents bysubscription_status(a custom user property) over time, perhaps correlating with specific product updates. - Funnel Exploration: Crucial for understanding user progression through a defined series of steps (e.g., sign-up process, purchase journey, onboarding flow). You can define each step as an event or page view and visualize drop-off rates between stages. This helps identify bottlenecks in your user experience and conversion paths, providing clear areas for optimization. For example, tracking the steps from “product page view” to “add to cart” to “checkout started” to “purchase” reveals where users are abandoning your e-commerce funnel.
- Path Exploration: This visualizes the sequence of events users take on your site, either forward (starting from a specific event) or backward (ending at a specific event). It helps uncover unexpected user journeys, identify common paths to conversion, or pinpoint where users might diverge from an intended flow. A startup could use this to see what users do immediately after downloading a whitepaper or after encountering an error message.
- Segment Overlap: This technique allows you to visualize how different user segments interact or overlap. For example, you could see how many users who completed a “trial_signup” event also triggered a “feature_x_used” event, and how many of those then went on to “purchase.” This is invaluable for understanding audience characteristics and targeting strategies.
- User Explorer: This report allows you to dive into the specific events and activities of individual, anonymized users. While not for identifying personal data, it’s powerful for understanding complex user behaviors and debugging. You can select a user ID and see their entire sequence of events, helping to diagnose issues or understand successful user journeys firsthand.
- Cohort Exploration: Cohorts are groups of users who share a common characteristic, such as the date they first visited your site or completed a specific event. This report tracks the behavior of these cohorts over time, revealing retention patterns and the long-term impact of marketing efforts or product changes. For a startup, understanding the retention of users acquired in a specific month or through a particular campaign is key to assessing long-term value.
- User Lifetime: Provides insights into the lifetime value of users, typically broken down by acquisition channel. This helps you understand which channels bring in the most valuable users over the long term, informing your marketing budget allocation, especially for Pay Per Click advertising where initial acquisition costs need to be justified by lifetime value.
Audiences: Building Custom Segments for Personalization and Remarketing
GA4’s audience builder is a powerful feature that allows you to create highly specific user segments based on events, parameters, and user properties. These audiences can then be used in several ways:
- Reporting: Apply audiences to your standard GA4 reports or explorations to analyze the behavior of specific user groups.
- Google Ads: Export audiences directly to Google Ads for remarketing campaigns. For example, you could create an audience of users who added items to their cart but didn’t purchase, and then target them with specific ads to encourage completion.
- Google Optimize: Use audiences for A/B testing and personalization efforts, delivering different content or experiences to different user segments.
Integrations: Expanding Your Data Ecosystem
GA4’s strength is amplified through its integrations with other platforms:
- Google Ads: As mentioned, linking GA4 to Google Ads allows for seamless data flow, enabling you to use GA4 conversions for bid optimization and gain deeper insights into campaign performance directly within GA4.
- Google Search Console: Integrating SCM brings organic search query data into GA4, helping you understand how users discover your site through search engines and which keywords drive traffic.
- BigQuery: For tech startups with large datasets, complex analysis needs, or a desire for data warehousing, the free BigQuery export in GA4 is a game-changer. It allows you to export your raw, unsampled event data to BigQuery, where you can run custom SQL queries, combine GA4 data with other datasets (e.g., CRM, product databases), and build advanced machine learning models. This integration is a crucial component for any data-intensive tech stack.
Predictive Capabilities
Leveraging machine learning, GA4 can generate predictive metrics such as:
- Purchase probability: The likelihood that a user who was active in the last 28 days will purchase in the next 7 days.
- Churn probability: The likelihood that a user who was active on your website or app in the last 7 days will not be active in the next 7 days.
- Revenue prediction: The total revenue expected from all active users in the next 28 days.
These predictive insights can inform your marketing strategies, allowing you to proactively target users likely to churn with retention offers or focus on users with high purchase probability.
Debugging with DebugView
When implementing new events or troubleshooting tracking issues, DebugView is your best friend. Accessible from the GA4 interface (under “Admin” > “DebugView”), it shows events firing on your website in real-time. By enabling debug mode (e.g., via a GTM Debugger or a browser extension), you can see all events and their parameters as they are sent to GA4, allowing you to confirm correct implementation and quickly identify any tracking errors.
By mastering these advanced GA4 features, your startup can move beyond basic reporting to conduct sophisticated analyses, build targeted audiences, and integrate GA4 seamlessly into a broader data ecosystem, unlocking deeper insights that drive strategic decisions and competitive advantage.
Best Practices for Startups and Digital Marketers Using GA4
Implementing Google Analytics 4 is just the first step; truly leveraging its capabilities requires adopting a strategic approach and adhering to best practices. For tech startups and digital marketers, optimizing your GA4 setup ensures you’re collecting relevant data, extracting actionable insights, and driving measurable growth.
1. Define Clear KPIs and Conversion Goals
Before diving deep into data, clearly articulate what success looks like for your website and business. What are your Key Performance Indicators (KPIs)? Are you focused on lead generation, e-commerce sales, content engagement, or SaaS subscriptions? Identify the core actions users take that contribute to these goals and configure them as conversions in GA4. For a startup, this might mean tracking sign-ups, demo requests, feature usage, or specific content downloads. Without defined goals, your data will lack context, making it difficult to assess performance or justify marketing spend, especially important for campaigns like Pay Per Click advertising where ROI is paramount.
2. Develop a Robust Event Tracking Plan
GA4 is event-driven, so a well-structured event tracking plan is non-negotiable. Don’t just rely on enhanced measurement; think strategically about custom events that reflect unique user interactions on your site.
-
Consistent Naming Conventions: Establish clear, consistent naming conventions for your events and parameters (e.g.,
button_clickinstead ofbtn_
Recommended Resources
Explore How To Improve Wi Fi Speed At Home for additional insights.
Learn more about this topic in What Is Ux Design And Why It Matters at Layout Scene.