In the fast-paced world of tech startups and digital marketing, launching a campaign is only half the battle. The true measure of success lies in the ability to accurately track, analyze, and interpret its results. Without robust measurement, even the most innovative campaigns are flying blind, unable to optimize, scale, or truly understand their impact on the bottom line. As we navigate towards 2026, the landscape of digital marketing continues to evolve at a breathtaking pace, making sophisticated measurement tools and methodologies not just an advantage, but an absolute necessity for survival and growth. For tech entrepreneurs, understanding how to effectively gauge campaign performance is paramount to making data-driven decisions that propel their ventures forward.
The Imperative of Precision: Why Campaign Measurement is Non-Negotiable
In an ecosystem where capital is often tight and competition fierce, every marketing dollar spent by a tech startup must deliver demonstrable value. The days of launching campaigns based on intuition alone are long gone. Today, precision and accountability are the bedrock of successful marketing strategies. Measuring business campaign results provides an unambiguous feedback loop, illuminating what works, what doesn’t, and why. This isn’t merely about justifying expenditure; it’s about strategic intelligence.
- Optimizing Return on Investment (ROI): The most direct benefit of campaign measurement is the ability to calculate ROI. By understanding which channels, messages, and audiences yield the highest returns, businesses can reallocate budgets more effectively, maximizing their impact and minimizing wasted spend. For a startup, this can be the difference between scaling rapidly and struggling to gain traction.
- Informed Decision-Making: Data collected from campaigns empowers entrepreneurs with objective insights. Instead of guessing, decisions about future campaigns, product features, or market expansion can be made with confidence, backed by empirical evidence. This reduces risk and increases the likelihood of success.
- Continuous Improvement: Campaign measurement fosters a culture of iterative improvement. By tracking performance over time, businesses can identify trends, spot anomalies, and continuously refine their strategies. This agile approach is critical in the dynamic digital environment of 2026, allowing companies to adapt quickly to changing market conditions and consumer behaviors.
- Competitive Advantage: Businesses that master campaign measurement gain a significant edge. They can react faster to market shifts, outperform competitors in ad auctions, and build stronger customer relationships through personalized and effective communication. Understanding your audience’s response with granular detail allows for a level of personalization and relevance that unmeasured campaigns simply cannot achieve.
- Resource Allocation & Efficiency: Beyond financial ROI, measurement helps optimize human resources and time. If a particular campaign type or channel consistently underperforms despite significant effort, the data clearly indicates where resources should be redirected to more fruitful endeavors. This ensures operational efficiency across the entire marketing function.
Foundational Metrics and Key Performance Indicators (KPIs) for Success
Before diving into tools, it’s crucial to establish a solid understanding of the metrics and KPIs that truly matter. Metrics are quantitative measurements, while KPIs are specific metrics that directly align with your business objectives. Not all metrics are KPIs, but all KPIs are metrics. The distinction is vital for focusing your measurement efforts.
Core Campaign Metrics:
- Impressions: The number of times your ad or content was displayed. This indicates reach and visibility.
- Reach: The unique number of users who saw your ad or content. Unlike impressions, reach accounts for unique individuals.
- Clicks: The number of times users interacted with your ad or link. This is a basic indicator of interest.
- Click-Through Rate (CTR): The percentage of impressions that resulted in a click (Clicks / Impressions * 100). A higher CTR suggests compelling ad copy or creative.
- Cost Per Click (CPC): The average cost you pay for each click on your ad. Essential for managing paid advertising budgets.
- Time on Page/Session Duration: How long users spend engaging with your content. Longer durations often indicate higher interest and engagement.
- Bounce Rate: The percentage of single-page sessions on your website (sessions in which the user left your site from the entrance page without interacting with anything else). A high bounce rate can signal irrelevant traffic or poor user experience.
Essential Campaign KPIs:
- Conversion Rate: The percentage of users who complete a desired action (e.g., purchase, sign-up, download) out of the total visitors (Conversions / Visitors * 100). This is a paramount KPI for almost any campaign, directly reflecting its effectiveness in achieving business goals.
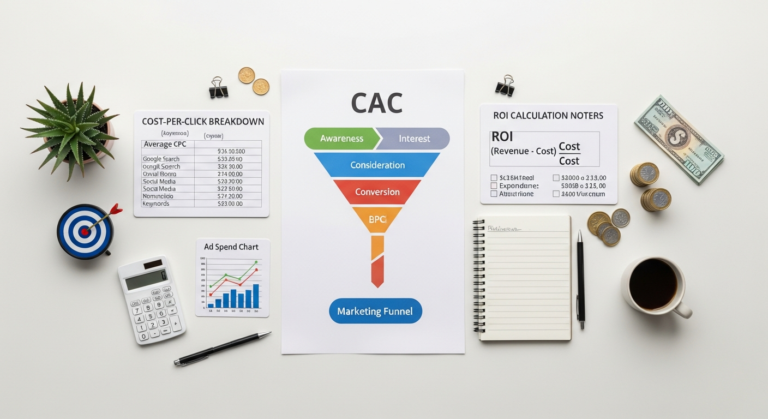
- Cost Per Acquisition (CPA) / Cost Per Lead (CPL): The average cost to acquire a new customer or generate a lead. This KPI is critical for budget planning and understanding the financial viability of your acquisition channels. It directly impacts profitability.
- Return on Ad Spend (ROAS): The revenue generated for every dollar spent on advertising. (Revenue from Ad Campaign / Cost of Ad Campaign). A vital metric for paid campaigns, indicating profitability.
- Customer Lifetime Value (CLTV): The total revenue a business can reasonably expect from a single customer account throughout their relationship. While not a direct campaign metric, understanding CLTV helps justify higher CPA for valuable customers and informs long-term marketing strategies.
- Lead-to-Customer Rate: The percentage of leads that ultimately convert into paying customers. This measures the effectiveness of your sales funnel and lead nurturing efforts.
- Engagement Rate: A measure of how actively users interact with your content, often calculated differently across platforms (e.g., likes, comments, shares per impression on social media). High engagement can indicate brand resonance and content effectiveness.
Defining these KPIs upfront, aligned with specific campaign objectives, is the first and most critical step in effective measurement. Without clear goals and corresponding KPIs, even the most sophisticated tools will only provide data, not insights.
Leveraging Analytics Platforms: The Core of Measurement in 2026
With the foundational metrics understood, the next step is to implement the right tools to collect and analyze this data. In 2026, the landscape of analytics platforms is more sophisticated and integrated than ever, offering powerful capabilities for understanding user behavior and campaign performance.
How to Use Google Analytics 4 (GA4): The Modern Standard
Google Analytics 4 (GA4) has become the cornerstone for website and app analytics, replacing Universal Analytics with its event-driven data model. For tech entrepreneurs, mastering GA4 is non-negotiable for comprehensive campaign measurement.
Understanding GA4’s Event-Driven Model:
Unlike Universal Analytics, which was session-based, GA4 treats every user interaction—from a page view to a video play or a purchase—as an “event.” This unified approach provides a more holistic view of the customer journey across various touchpoints (website, mobile app) and devices. It allows for greater flexibility in tracking custom interactions specific to your business model.
Practical Steps for Campaign Measurement with GA4:
- Configuration and Data Streams:
- Ensure your GA4 property is correctly set up, with data streams for your website and any mobile apps. This foundational step ensures all relevant user data is being collected.
- Enable Google Signals for enhanced cross-device tracking and audience insights, respecting user privacy.
- Defining and Tracking Conversions:
- In GA4, conversions are simply specific events that you mark as valuable. Navigate to “Admin” -> “Events” and toggle on “Mark as conversion” for critical actions like form submissions, purchases, demo requests, or app installs.
- For custom events (e.g., ‘scroll_depth_50_percent’, ‘video_watched_75_percent’), you’ll need to implement them via Google Tag Manager (GTM) or directly in your code, then mark them as conversions. This allows you to measure micro-conversions that indicate user engagement and intent.
- Leveraging Standard Reports for Campaign Analysis:
- Acquisition Reports: These are your go-to for understanding where your traffic comes from.
- The Traffic Acquisition report shows sessions and conversions broken down by source, medium, campaign, and default channel grouping. Use this to assess the performance of your paid ads (Google Ads, social media ads), organic search, email campaigns, and referral traffic.
- The User Acquisition report focuses on the source of new users, helping you understand your initial reach.
- Engagement Reports:
- The Events report lists all events fired on your site/app, allowing you to see the frequency of key interactions.
- The Conversions report provides a quick overview of your marked conversion events and their performance.
- The Pages and Screens report helps you understand which content is most popular and engaging, crucial for optimizing content marketing efforts.
- Monetization Reports:
- If you have e-commerce tracking set up, these reports (e.g., E-commerce purchases, Purchases by item) provide detailed insights into revenue, product performance, and conversion funnels, directly linking campaign efforts to financial outcomes.
- Acquisition Reports: These are your go-to for understanding where your traffic comes from.
- Utilizing Explorations (formerly Analysis Hub):
- This powerful section allows for custom, deep-dive analysis.
- Funnel Exploration: Visualize the steps users take to complete a conversion, identifying drop-off points in your campaign flows.
- Path Exploration: Understand user journeys, revealing common paths before and after specific events, which can inform content strategy and UI/UX improvements.
- Segment Overlap: Discover how different user segments (e.g., users from Campaign A vs. users who converted) interact with each other.
- This powerful section allows for custom, deep-dive analysis.
- Connecting GA4 with Other Platforms:
- Integrate GA4 with Google Ads, Search Console, and other Google products for a unified view of your marketing ecosystem. This allows for seamless data flow and enhanced reporting directly within GA4. For instance, connecting with Google Ads helps you see campaign costs and ad performance alongside on-site behavior.
By effectively using GA4, entrepreneurs gain unparalleled visibility into how their campaigns drive user behavior, allowing for iterative improvements and strategic resource allocation. The focus on user journey and event-based tracking makes it particularly powerful for understanding complex conversion paths common in tech products.
Other Essential Analytics Tools:
- Google Search Console: Indispensable for SEO campaign measurement. It provides data on organic search performance, including keywords driving traffic, impressions, clicks, and average position. It also alerts you to indexing issues and mobile usability problems.
- Social Media Analytics: Platforms like Meta Business Suite (Facebook/Instagram), Twitter Analytics, LinkedIn Analytics, and TikTok Business provide native insights into reach, engagement, follower growth, and post performance, crucial for social media campaigns.
- Email Marketing Platforms: Tools like Mailchimp, HubSpot, or Constant Contact offer detailed metrics on open rates, click-through rates, unsubscribes, and conversions from email campaigns, allowing for A/B testing of subject lines, content, and send times.
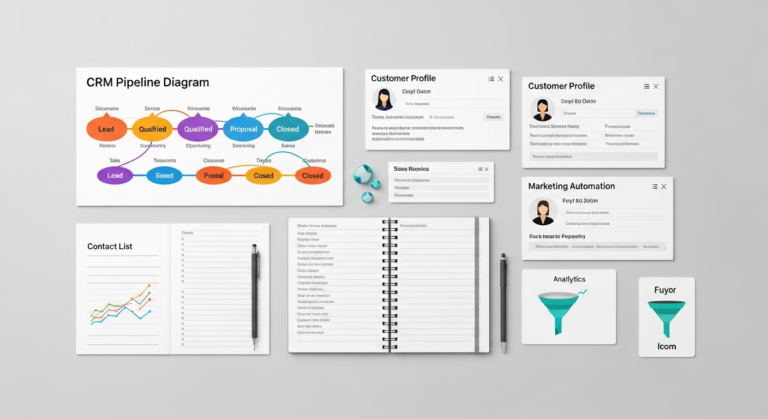
- CRM Systems (e.g., Salesforce, HubSpot CRM): Beyond marketing, CRM systems track the entire customer lifecycle, linking marketing leads directly to sales outcomes and customer lifetime value. This provides the ultimate proof of campaign ROI.
Advanced Measurement Techniques for Deeper Insights

While foundational analytics provide the “what,” advanced techniques delve into the “why,” offering a richer understanding of user behavior and campaign effectiveness.
- A/B Testing and Multivariate Testing: These methodologies are critical for Conversion Rate Optimization (CRO). By testing different versions of a webpage, ad copy, or email against a control, you can empirically determine which elements perform best. A/B testing focuses on one variable at a time, while multivariate testing allows for simultaneous testing of multiple variables and their interactions. Tools like Google Optimize (soon to be integrated into GA4/Google Ads), Optimizely, and VWO facilitate these tests.
- Heatmaps and Session Recordings: Tools such as Hotjar or Crazy Egg provide visual insights into user behavior on your website.
- Heatmaps show where users click, scroll, and spend their time, revealing areas of interest or neglect.
- Session Recordings allow you to watch anonymized recordings of actual user sessions, offering invaluable qualitative data on user struggles, confusion, and navigation patterns. This can uncover UX issues that analytics alone might miss.
- User Surveys and Feedback Widgets: Directly asking your users for feedback provides qualitative data that complements quantitative analytics. On-site surveys (e.g., using Hotjar, SurveyMonkey) can gather insights into user intent, pain points, and satisfaction levels, informing both campaign and product development.
- Attribution Modeling: As discussed in a later section, advanced attribution models move beyond last-click to give credit to all touchpoints in a customer’s journey, providing a more accurate understanding of channel effectiveness. GA4’s data-driven attribution is a significant step forward here.
- Marketing Automation and CRM Integration: Integrating your marketing automation platform (e.g., HubSpot, Marketo) with your CRM and analytics tools creates a unified view of the customer journey from first touch to conversion and retention. This allows for sophisticated lead scoring, personalized nurturing campaigns, and precise ROI measurement across the entire funnel.
Optimizing for Impact: Conversion Rate Optimization (CRO) and How to Get More Website Traffic
Measuring campaign results isn’t just about reporting; it’s about using those insights to optimize performance. Two critical areas for optimization are Conversion Rate Optimization (CRO) and strategic traffic generation.
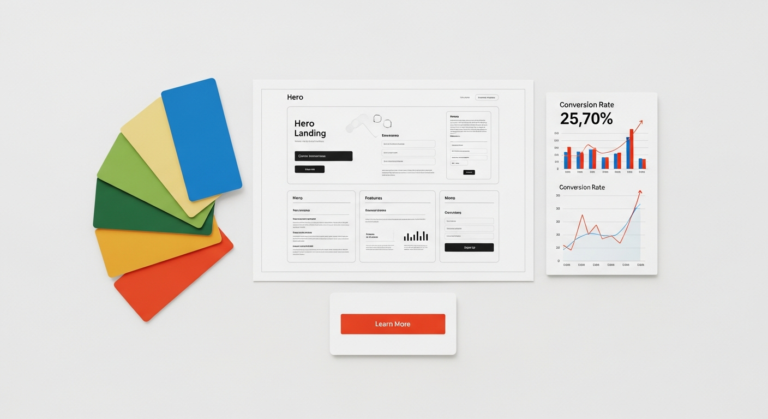
Conversion Rate Optimization (CRO): Turning Visitors into Customers
Conversion Rate Optimization (CRO) is the systematic process of increasing the percentage of website visitors who complete a desired goal (a conversion). It’s about getting more out of your existing traffic, rather than simply trying to get more traffic. For tech startups, a strong CRO strategy can significantly boost growth without necessarily increasing marketing spend.
Key Aspects of CRO:
- Identify Bottlenecks: Use GA4’s Funnel Explorations, heatmaps, and session recordings to pinpoint where users drop off in your conversion paths (e.g., checkout process, sign-up forms, landing pages).
- Formulate Hypotheses: Based on your data, hypothesize why users are dropping off and what changes could improve the conversion rate. For example, “Changing the CTA button color to orange will increase clicks because it stands out more.”
- A/B Test Your Hypotheses: Implement the proposed changes and run A/B tests to empirically validate your hypotheses. Test elements like:
- Landing Page Design: Layout, imagery, value proposition clarity.
- Call-to-Action (CTA): Wording, color, placement, size.
- Form Fields: Number of fields, clarity of labels, error messages.
- Headlines and Copy: Clarity, compelling language, relevance.
- User Experience (UX): Navigation, page load speed, mobile responsiveness.
- Analyze and Implement: Analyze the test results with statistical significance. If a variation significantly outperforms the control, implement it permanently. If not, learn from the results and iterate with new hypotheses.
- Personalization: Use collected data to personalize content and offers for different user segments, increasing relevance and conversion probability.
CRO is an ongoing process of continuous improvement. By consistently optimizing your conversion funnels, you ensure that the traffic you acquire is maximized for business outcomes.
How to Get More Website Traffic: Quality Over Quantity
While CRO focuses on efficiency, effective campaigns also require a robust strategy for generating qualified traffic. However, the emphasis should always be on quality traffic that is likely to convert, rather than just volume.
Strategies for Generating Qualified Traffic:
- Search Engine Optimization (SEO):
- Keyword Research: Identify relevant keywords your target audience uses to find solutions. Focus on long-tail keywords for higher intent.
- Content Marketing: Create high-quality, valuable content (blog posts, guides, whitepapers, case studies) optimized for your keywords. This attracts organic traffic, establishes authority, and nurtures leads. Measure content performance via GA4 (page views, time on page, conversions).
- Technical SEO: Ensure your website is crawlable, fast, mobile-friendly, and secure. Use Google Search Console to monitor performance and identify issues.
- Backlink Building: Acquire high-quality backlinks from authoritative sites to improve your domain authority and search rankings.
- Search Engine Marketing (SEM) / Paid Search:
- Google Ads: Run targeted PPC campaigns based on keywords, demographics, and user intent. Continuously optimize bids, ad copy, and landing pages based on GA4 conversion data and CPA.
- Bing Ads: Explore other search engines for potentially lower competition and cost.
- Social Media Marketing (Organic & Paid):
- Organic Social: Build a strong brand presence and engage with your audience on relevant platforms (LinkedIn for B2B, TikTok/Instagram for B2C). Share valuable content and drive traffic back to your site. Track engagement and referral traffic in GA4.
- Paid Social (Meta Ads, LinkedIn Ads, etc.): Utilize precise targeting options to reach specific demographics, interests, and behaviors. Measure CTR, CPC, and conversions directly from platform analytics and GA4.
- Email Marketing:
- Build an email list through compelling lead magnets (e.g., free guides, webinars).
- Send targeted newsletters, product updates, and promotional offers. Measure open rates, CTR, and conversions to optimize future campaigns. Email is excellent for nurturing leads and driving repeat traffic.
- Referral Marketing & Partnerships:
- Collaborate with complementary businesses or influencers to tap into new audiences. Measure referral traffic and conversions in GA4.
Remember, the goal is not just more traffic, but more traffic that converts. Integrate your traffic generation efforts with your measurement tools to continually refine your strategy and focus on channels that deliver the highest ROI.
Attribution Models: Understanding the Customer Journey
In today’s multi-touchpoint customer journeys, simply crediting the last interaction before a conversion can be misleading. Attribution models help distribute credit across various touchpoints, providing a more accurate understanding of each channel’s contribution.
Common Attribution Models:
- Last-Click Attribution: Assigns 100% of the conversion value to the last click before the conversion. Simple but often undervalues earlier touchpoints.
- First-Click Attribution: Assigns 100% of the conversion value to the first interaction. Good for understanding initial awareness but ignores nurturing efforts.
- Linear Attribution: Distributes credit equally across all touchpoints in the conversion path. Provides a balanced view.
- Time Decay Attribution: Assigns more credit to touchpoints closer in time to the conversion. Useful for shorter sales cycles.
- Position-Based (or U-Shaped) Attribution: Assigns 40% credit to the first and last interactions, and the remaining 20% is distributed evenly among middle interactions. Balances awareness and conversion-driving efforts.
- Data-Driven Attribution (DDA): This is where GA4 truly shines. DDA uses machine learning to analyze your specific conversion paths and assign fractional credit to each touchpoint based on its actual contribution to conversions. It’s the most sophisticated and accurate model, as it’s customized to your data.
Choosing the right attribution model is crucial for accurately allocating marketing budgets and understanding the true value of different channels. For tech entrepreneurs, moving towards data-driven attribution (available in GA4) by 2026 is a strategic imperative to optimize spending and maximize campaign effectiveness.
Integrating Data for Holistic Insights and Predictive Power
The future of campaign measurement lies in data integration and the application of advanced analytics, including AI and machine learning. Fragmented data across disparate platforms provides an incomplete picture. For a truly holistic understanding of business campaign results, integration is key.
- Unified Data Warehousing: Consolidating data from GA4, CRM, advertising platforms, social media, and email marketing into a central data warehouse (e.g., Google BigQuery, Snowflake) allows for cross-platform analysis that is impossible with individual tools. This enables richer segmentation, custom reporting, and the identification of complex patterns.
- Data Visualization Tools: Platforms like Looker Studio (formerly Google Data Studio), Tableau, or Power BI are essential for transforming raw data into intuitive, actionable dashboards. These tools help stakeholders quickly grasp performance trends, identify areas for improvement, and monitor KPIs at a glance. Creating a single source of truth through a unified dashboard fosters data-driven culture across the organization.
- Predictive Analytics with AI/ML: By 2026, AI and machine learning will be increasingly integral to campaign measurement. GA4 already offers predictive metrics like churn probability and purchase probability. Leveraging these capabilities, combined with custom ML models built on integrated data, allows businesses to:
- Forecast future campaign performance and ROI.
- Identify high-value customer segments before they convert.
- Automate anomaly detection in campaign performance.
- Personalize user experiences and ad targeting at scale.
- Closed-Loop Reporting: This involves connecting marketing campaign data directly to sales outcomes and customer lifetime value in your CRM. It provides a complete feedback loop, showing the ultimate impact of marketing efforts on revenue and profitability, moving beyond mere leads or conversions to actual closed deals.
For tech startups, investing in data integration and leveraging predictive analytics capabilities will be a significant differentiator. It allows for proactive optimization, smarter resource allocation, and a deeper understanding of the long-term value generated by marketing initiatives.
Measuring business campaign results is an intricate but profoundly rewarding endeavor. By adopting a systematic approach, leveraging powerful tools like Google Analytics 4, embracing Conversion Rate Optimization, strategically generating quality traffic, and understanding attribution, tech entrepreneurs can transform their marketing efforts from guesswork into a precise, data-driven engine for growth. The landscape of 2026 demands nothing less than meticulous measurement and continuous optimization to truly thrive.
Frequently Asked Questions
Recommended Resources
Check out Branding Design Basics For Small Business on Layout Scene for a deeper dive.
You might also enjoy Digital Declutter Guide For Productivity from Bookmark Sharer.